
Tracking your website visitors is like having a clear window into your clients' minds. It reveals the full story: which of your marketing efforts are actually bringing in bookings, which pages on your site convince people to buy, and where they get stuck or leave. This knowledge is the difference between guessing what works and knowing what grows your business.
Why Tracking Visitors Is a Game Changer for Your Business
Once you learn how to track website visitors, you can shift from a hopeful "I hope this works" strategy to a proactive, data-driven one. This isn't just about counting visitors; it's about understanding their behavior so you can perfect your booking process, improve their experience, and invest your marketing budget where it truly counts.
For a business owner, this means getting direct, actionable answers to crucial questions:
- Where are my clients coming from? Are they finding you through Instagram, a Google ad, or that blog post you wrote last month? Tracking shows you which channels drive the most valuable traffic.
- What content do they find most engaging? Discover which blog posts, service pages, or galleries get the most attention. Use this insight to create more of what your audience loves.
- Where are potential clients getting stuck? Pinpoint the exact pages where people abandon their booking or leave your site. This helps you quickly identify and fix issues, like a confusing form or unclear pricing.
Think of it as a simple, powerful cycle: you collect data, find actionable insights, and turn those insights into real-world business growth.
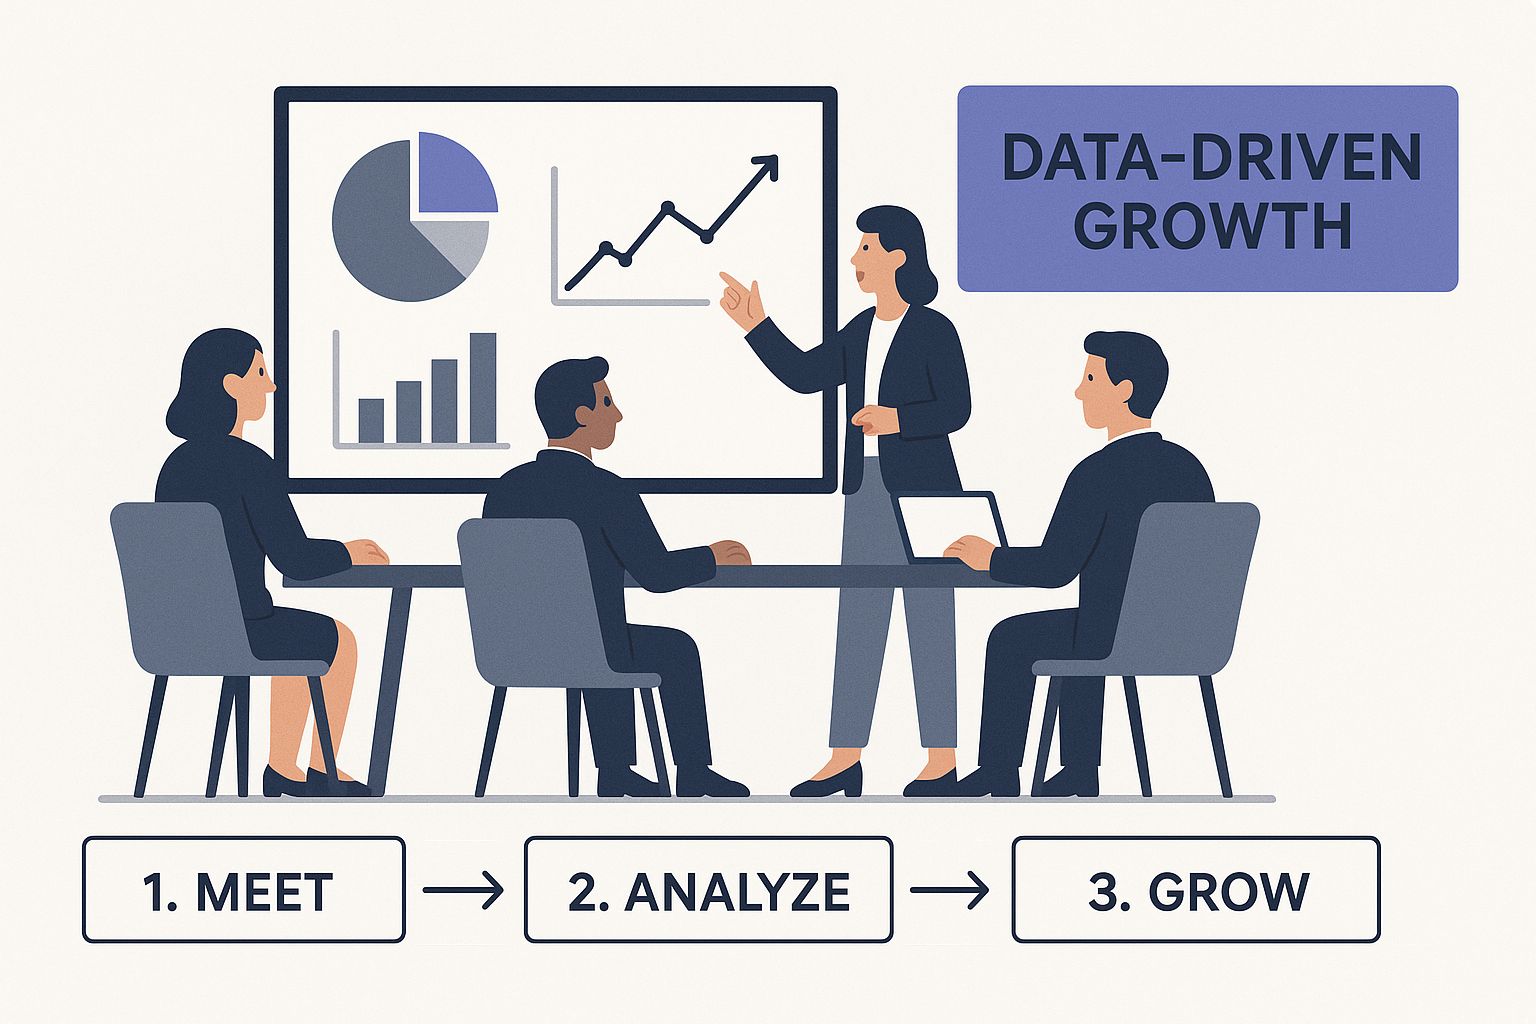
As you can see, the path from raw data to a healthier business is a straightforward, repeatable process.
Understanding the Impact on Your Bottom Line
Website visitor tracking works by using simple technology, like cookies and tracking codes, to understand how people interact with your site—where they came from, what pages they viewed, and what they clicked on. It might surprise you, but many medium-sized businesses see traffic between 50,001 and 10 million visitors monthly. This highlights the sheer volume of valuable data available to you every day.
The real benefit is simple: when you understand how visitors behave, you can tweak your site to turn more of them into paying clients.
This insight allows you to stop spending money on marketing that doesn't work and double down on what does. Every data-driven improvement you make is directly connected to your revenue.
Of course, before you start tracking, it helps to have a site ready to welcome visitors. Brushing up on some actionable website promotion ideas is a great first step. Building this foundation ensures that once the data starts rolling in, you'll be ready to make the most of every visit.
Setting Up Google Analytics 4 for Accurate Insights
Let's get you set up with Google Analytics 4 (GA4). It's the industry-standard tool for understanding your website traffic. However, a sloppy setup leads to messy, unreliable data, and you can't make smart business decisions with bad information.
This section provides a straightforward walkthrough for business owners—no developer skills needed.

Follow these essential steps to ensure the numbers you see accurately reflect what's happening on your website.
Your First Steps with GA4
Getting started involves creating a GA4 "property," which is simply Google's term for your website's analytics profile. Think of it as a dedicated folder for all your visitor data.
Step 1: Create Your Account and Property
Head to the Google Analytics website and sign in with your Google account. You'll be guided to create an account (use your business name) and then your first property (use your website's name).
Step 2: Set Up Your Data Stream
GA4 will ask you to create a "data stream." Since you are tracking a website, choose the “Web” option. Enter your website’s URL and give the stream a name, like "My Business Website."
Step 3: Get Your Measurement ID
Once you've created the data stream, Google will give you a Measurement ID. It’s a unique code that looks like G-XXXXXXXXXX. This ID is the key that connects your website to GA4. Copy it and keep it handy for the next step.
Step 4: Add the ID to Your Website
Now, you need to install this ID on your site so Google can start collecting data. The method depends on your website platform:
- For WordPress: The easiest way is to use a plugin like GA Google Analytics or Site Kit by Google. Install the plugin, navigate to its settings, and paste your Measurement ID into the designated field.
- For Shopify: Go to
Online Store>Preferences. You will find a Google Analytics section where you can paste your ID. - For Squarespace or Wix: Look for an "Integrations" or "Marketing Tools" section in your site's settings. These platforms typically have a specific field for your Google Analytics ID.
Fine-Tuning for Clean Data
Pasting the code isn't quite enough for accurate data. A common mistake is forgetting to filter out your own visits to your website. Every time you or your team check the site, you're unintentionally skewing the data.
The goal is to track your customers, not yourself. Excluding internal traffic is a non-negotiable step for getting reliable data you can base real business decisions on.
Here’s the quick fix: tell GA4 to ignore traffic from your office or home. In your GA4 dashboard, go to Admin > Data Streams and click your web stream. Find Configure tag settings, click Show all, and select Define internal traffic.
From here, you can create a rule to exclude traffic from your IP address. This simple action makes your data significantly more reliable, ensuring your reports reflect genuine customer behavior.
Making Sense of Your Analytics Data
With your tracking set up, data will start flowing in. Now, how do you turn those numbers and charts into actionable business intelligence? Think of analytics terms like Engaged sessions and Traffic acquisition as clues to understanding what your clients actually do on your site.
Engaged sessions tell you who is sticking around and interacting, while Traffic acquisition reveals how people found you. For perspective, in 2025, it's estimated that 53% of website visits will come from organic search (like Google), 25% from people typing your URL directly, and the rest from referrals (13%), paid ads (5%), and social media (4%). Read the full research about key website metrics.
"Traffic sources tell you a story. If your organic traffic dips below 40%, it’s a bright, flashing sign that you need to give your SEO some serious love." – A fellow salon owner I know.
Where Is Your Traffic Coming From?
Let’s break down the main traffic channels so you know where to focus your marketing efforts.
- Organic Search: This is pure gold. It represents people who found you by searching for terms like "best facial near me," revealing their immediate needs.
- Direct: These are visitors who already know you. They typed your website address directly into their browser, indicating strong brand recognition and customer loyalty.
- Referrals: This is your digital word-of-mouth. It tracks visitors who clicked a link from another website, such as a local business directory or a partner’s blog.
- Paid Search: This measures the effectiveness of your ad spend. Are your Google Ads bringing in quality traffic that leads to bookings? This channel has the answer.
- Social Media: This shows how well your Instagram, Facebook, or other social campaigns are driving people to your website.
What Are They Doing Once They Arrive?
Now let's decode what visitors do on your site. Use this table to understand key metrics and the business questions they answer.
Key Website Metrics and What They Tell You
| Metric | What It Measures | Business Insight It Provides |
|---|---|---|
| Unique Visitors | The number of distinct individuals visiting your site. | How big is my actual audience? |
| Sessions | The total number of visits to your website. | How much overall interest is my site generating? |
| Pageviews | The total number of pages viewed. | Is my content engaging enough to make people click around? |
| Bounce Rate | Visitors who leave after viewing only one page. | Is my landing page doing its job or turning people away? |
| Avg. Session Duration | How long, on average, a visitor stays on your site. | Are people genuinely engaged with what they're seeing? |
| Conversion Rate | The percentage of visits that result in a booking or sale. | How effective are my calls-to-action at turning visitors into clients? |
Think of these metrics as a report card for your website. A high bounce rate on a service page could mean your pricing is unclear. A low average session duration might indicate your content isn't compelling enough.
Turn That Data Into a Story (and More Bookings)
Numbers alone are just numbers. The real power comes from using them to tell a story and take action.
Imagine your analytics show a blog post about makeup tutorials gets lots of traffic, with visitors spending an average of 4 minutes on the page. That's great engagement! But the conversion rate is a dismal 2%. This tells a clear story: people love the content but aren't being prompted to book.
Here are some quick, actionable changes you can make:
- Add a bold "Book a Makeup Lesson" button near the top of the post.
- Link key phrases in the text (like "smoky eye") directly to your relevant service pages.
- Experiment with different button text. Does "Book Now" perform better than "Learn More"?
To get even more advanced, you can learn what is attribution modeling. This helps you understand which marketing channels deserve credit for a final booking, giving you a clearer picture of your entire marketing funnel.
See What Your Visitors See
Sometimes, you need more than numbers; you need to see your website through your visitors' eyes. Tools like heatmaps and session recordings show you exactly where people click, scroll, and get stuck. You can watch a recording of a real user trying to book an appointment and instantly spot a confusing form or a hard-to-find button.
- Use heatmaps to identify "cold zones"—important areas on your pages that get zero clicks.
- Watch session recordings to see the exact moment a user abandons a form.
- Compare desktop vs. mobile behavior to ensure your site is easy to use on all devices.
Combining these visual insights with your analytics gives you the full picture. It’s not just about tracking visitors; it’s about understanding their experience so you can make it better and drive growth for your business.
Seeing What Your Visitors See with Behavior Tools
Standard analytics tell you what your visitors did—they clicked a certain page or left from another. But they often fail to tell you why.
For example, you might see a high bounce rate on your services page. Is the pricing unclear? Is the "Book Now" button broken on mobile? Behavior tools like heatmaps and session recordings help you answer these questions by showing you exactly how users interact with your site. It's like watching over their shoulder as they browse.

These tools turn abstract data into a clear visual story, revealing frustrating user experiences you would otherwise miss.
Uncovering User Frustration with Heatmaps
Heatmaps are color-coded overlays on your web pages that show "hot" (popular) and "cold" (ignored) spots at a glance. Red means lots of interaction; blue means very little.
Here are the key types to use:
- Click Maps: Show exactly where people click. You might discover users are clicking on an image that isn't a link, which is a clear signal to either make it clickable or redesign the element.
- Scroll Maps: Show how far down a page visitors scroll. If your call-to-action button is in a "cold" blue zone at the bottom, you know most people never see it. The actionable insight? Move it higher up the page.
- Move Maps: Track mouse movements, which often correlate with eye movements. This helps you see which headlines and images grab attention first.
By analyzing heatmaps, you can make simple, impactful changes. Moving a key button from a blue zone to a red one can dramatically improve your booking rate. This is the essence of website performance optimization—making small tweaks that lead to a much better user experience.
Watching Real User Journeys with Session Recordings
While heatmaps aggregate data from all visitors, session recordings let you watch a single user's visit from start to finish. You can see every mouse movement, click, and scroll, providing unparalleled insight into their journey.
Session recordings are the most powerful tool for building empathy for your users. Watching someone struggle to find your contact info or abandon the booking form in frustration is an eye-opening experience that no spreadsheet of data can ever replicate.
This is how you discover the why behind the numbers. You might watch a recording and spot a bug that prevents iPhone users from completing a booking—a critical issue you would never find in standard analytics.
Many tools are available, offering features like funnel analysis and live monitoring. For a comprehensive look at your options, check out this guide to the best visitor tracking tools.
By combining quantitative data from analytics with these qualitative visual insights, you can truly understand your visitors and optimize their experience.
From Clicks to Clients: Turning Your Data into Growth
Collecting visitor data is just the first step. The real value comes from using that information to make strategic changes that lead to more bookings and happier clients. It’s time to move from analyzing charts to taking action.
This process is not a one-time task but a continuous cycle: learn from your data, make an improvement, measure the result, and repeat.
Reading the Tea Leaves: What Your Data is Telling You
Your analytics will quickly start revealing what's working and what's not. Your job is to listen and respond. Here are two common scenarios for business websites and the actionable steps you can take.
Scenario 1: The Popular Blog Post That’s a Dead End
A blog post on "5 Summer Skincare Tips" brings in hundreds of new visitors from Google each month, but nearly everyone leaves your site after reading it. This is a huge missed opportunity.
- Your Move: Add a clear call-to-action (CTA) near the top of the post. Instead of waiting until the end, include a button that says, “Ready for Glowing Summer Skin? Book Your Hydrafacial Today.”
- Your Move: Link relevant keywords within the article directly to your service pages. When you mention exfoliation, link that word to your microdermabrasion service page to guide readers to the next logical step.
Scenario 2: Tons of Mobile Visitors, But No Bookings
Your analytics show that 70% of your traffic is from mobile phones, but the mobile conversion rate is only 1%, compared to 5% on desktop. This is a clear sign that your mobile experience needs immediate attention.
- Your Move: Test your own website on your phone. Go through the entire process of booking an appointment. Is the form difficult to fill out? Are the buttons too small? Be your own toughest critic.
- Your Move: Simplify your mobile navigation. A mobile user is often in a hurry. Ensure your "Book Now" button and phone number are immediately visible without any scrolling or menu-digging required.
Data tells you where the fire is; your action is what puts it out. A high exit rate isn't a failure—it's a clear instruction to improve the user's journey.
Creating a Cycle of Continuous Improvement
Turning data into growth is about building a habit. Block off one or two hours each month to review your key metrics and identify one area for improvement. This consistent process of testing and refining is what sets successful online businesses apart.
For a structured approach to this process, explore guides on conversion rate optimization best practices.
When you are investing in paid advertising, it's crucial to track your return on investment. Setting up Google Ads conversion tracking is essential for connecting your ad spend directly to bookings, allowing you to make sharp, profitable decisions about your marketing budget.
Common Questions About Tracking Website Visitors
Getting started with website tracking often brings up questions about legality, tools, and best practices. Let's address some of the most common concerns for business owners.
Is It Legal to Track Website Visitors?
Yes, it is completely legal, but you must follow privacy regulations like the GDPR (in Europe) and CCPA (in California). Compliance is not optional.
Here are the key actions to stay compliant:
- Have a clear privacy policy: Your policy should explain what data you collect and how you use it.
- Use a cookie consent banner: You must inform visitors that your site uses cookies and give them the choice to accept or decline.
- Be transparent: Honesty builds trust. Being upfront about your tracking practices is a sign of respect for your clients' privacy.
Following these rules is not just about avoiding fines; it's about building a trustworthy relationship with your customers.
What Is the Best Tool for a Small Business?
For most small businesses, Google Analytics 4 is the perfect starting point. It's free, incredibly powerful, and integrates with nearly every other marketing tool. It provides all the essential data you need to get started.
Once you are comfortable with GA4, consider adding a behavior analytics tool. Free options like Microsoft Clarity or a free plan from Hotjar are excellent choices. They provide visual insights like heatmaps and session recordings that bring your GA4 data to life.
Don’t try to master five different tools at once. Start with Google Analytics, really get to know it, and then layer on something new only when you have a specific question your current setup can't answer.
How Long Should I Wait Before Making Decisions Based on Data?
Patience is key. Making significant changes based on a single day or week of data is a common mistake, as traffic can fluctuate for many reasons.
As a rule of thumb, collect at least 30 days of data before identifying meaningful trends. This timeframe helps smooth out random spikes and gives you a more accurate picture of user behavior.
For major strategic decisions, such as a website redesign or pricing changes, it's best to analyze data from an entire quarter. This ensures you are acting on stable patterns, not temporary noise.
Ready to build a stunning website that's optimized to attract and track your ideal clients from day one? The team at gohappybeauty designs beautiful, high-performing websites specifically for beauty professionals like you. Explore our designs and see how we can help your business shine online.